Mid-South Regional Resilience Plan

The Mid-South Regional Resilience Master Plan (RRMP) addresses increasing climate and weather-related vulnerabilities across the Mid-South through a comprehensive roadmap focused on long-term resilience. Funded by the HUD National Disaster Resilience Competition, the RRMP provides a set of recommendations that act as a “toolbox” for various audiences, including public officials, planners, and residents, each of whom plays a role in its implementation. This plan emphasizes resilience as a multi-system challenge, considering social, ecological, and infrastructural systems and the interdependencies among them. Rather than focusing on emergency responses, the RRMP outlines preventive strategies, highlighting resilience investments as cost-effective and beneficial for public well-being and regional growth. Developed over two years with extensive community input, the RRMP reframes resilience as a proactive investment that enhances safety, economic development, and quality of life, with recommendations designed to evolve alongside changing threats and regional dynamics.


Mapping Strategies: The report emphasizes the use of GIS to map flood resilience and disaster preparedness strategies across the Mid-South region, creating thematic and analytical maps that help stakeholders visualize and implement these strategies. These maps also contribute to a spatial-relational database, allowing for the analysis of urban development trends (as shown in the map above) and the potential impact of new policies and zoning on fostering resilient development. The report includes maps across seven key themes: waterways, watersheds, buildings, land planning, infrastructure, postdisaster planning, and governance, each with strategies tailored to these areas.
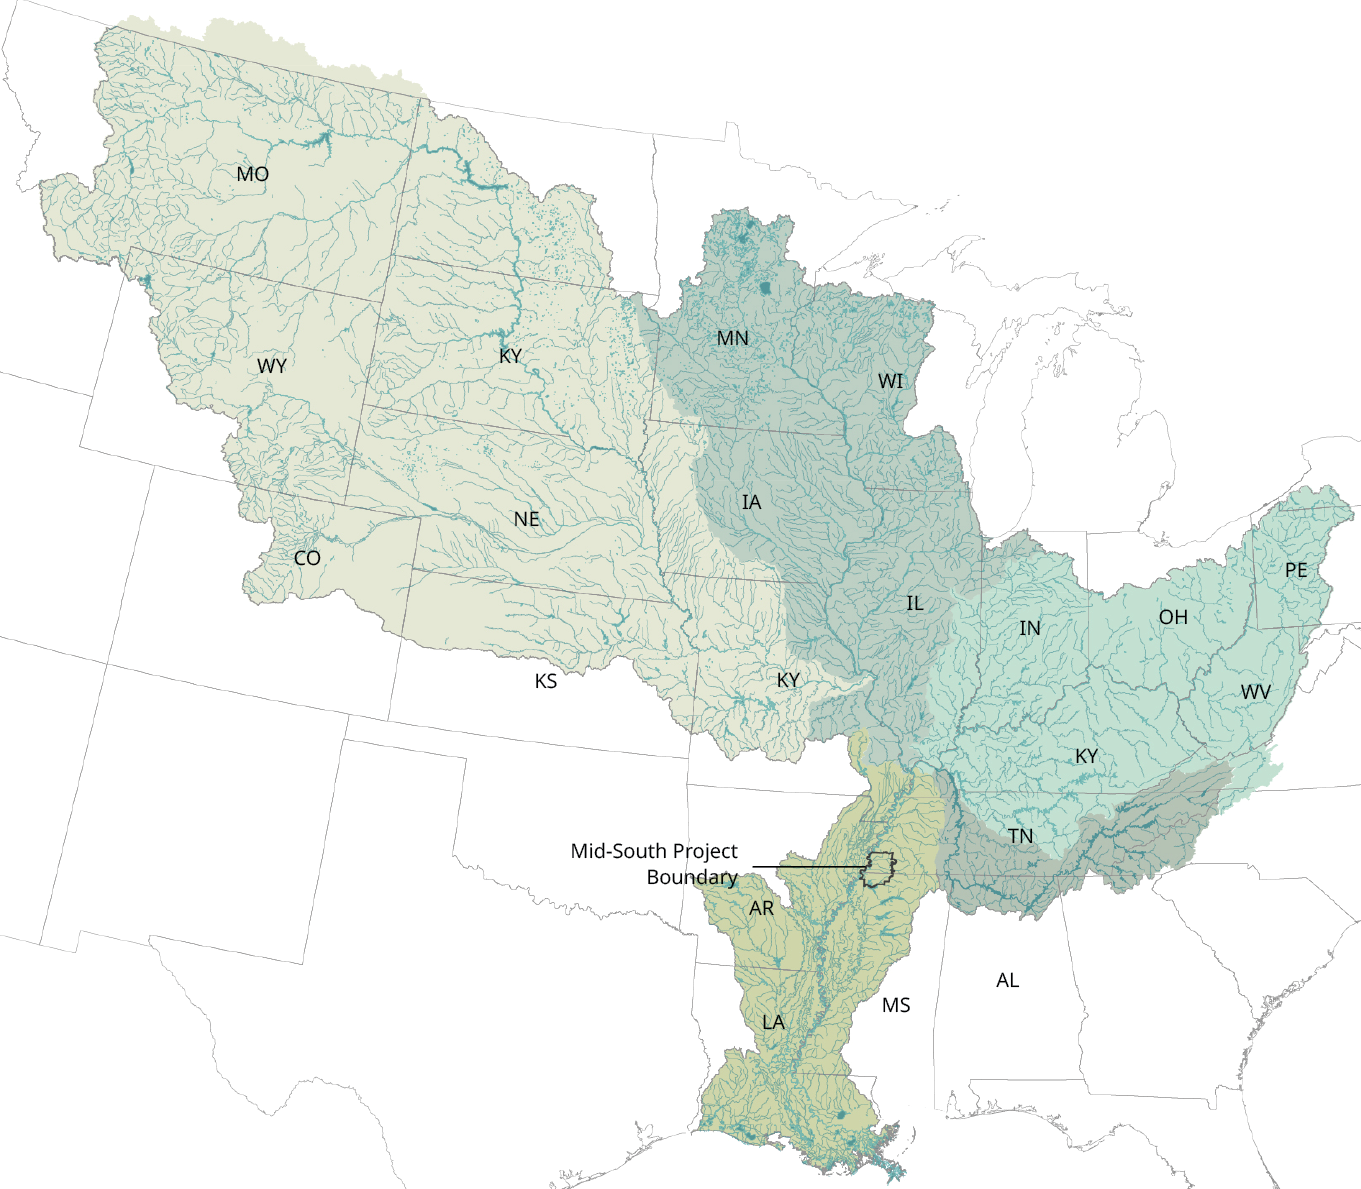
Thinking Regionally: Resilience planning requires a regional perspective, as local infrastructure and environmental risks, like flooding, are influenced by larger networks such as the Mississippi watershed. Effective risk reduction often depends on regional collaboration and GIS mapping to identify vulnerabilities and target areas for resilience projects. This approach highlights connections across infrastructure, population trends, and environmental systems, supporting comprehensive resilience strategies.

Composite Map: The composite map above illustrates several key layers— overlaying ecological layers with critical infrastructure, buildings, and key assets and facilities identified in subsequent recommendations throughout the RRMP. Through overlaying information, useful overlaps can be identified between various systems, such as the location of critical facilities located in the floodplain. These critical facilities provide important functions in cases of disaster or in the management of particular hazards. If flooding were to incapacitate these facilities, the critical functions they provide would be one less element that may help to mitigate the threat to the health and safety of residents that flooding alone would have.

Mapping Landscape Systems: This map highlights key spatial layers from the recommendations on regional landscape and ecological assets, focusing on the interconnected water flows that shape the area’s resilience. The Mississippi River and its tributaries are essential to local ecological stability, with flood events linked to these hydrological networks. Open spaces and trails provide both risk mitigation and recreation, while aquifer recharge areas sustain local drinking water supplies. Additionally, the 500-year floodplain is shown to emphasize the risks to buildings and infrastructure situated nearby.

Conservation Priority Areas: This map compiles areas that are important to conserve for watershed health. Major parcels of public land are outlined with a dark blue border. The majority of public parcels are located in Shelby County as there are not many publicly-owned parcels with high priority levels in DeSoto County. Concern areas are shaded based on a 0-11 scored scale indicating priority level and indicated with a gradient overlay is shown on the map to the right with colors from light green (low score) to dark blue (high score).

Context for Cooperative and Community-Based Energy Systems: Community-scale systems (such as microgrids) can help build systemic resilience and mitigate the danger of overall systemic failure by decentralizing critical aspects of energy and water distribution. This section (of the plan) elaborates on the steps needed to implement a community-based system within the larger network. Special emphasis is given to the differences in utility companies that share energy distribution territory within the Mid-South and the ownership structures that enable localized distributed energy infrastructure. Additionally, this section (of the plan) directs interested communities, utility and government personnel, and green entrepreneurs to important resources for expanding on community-scale solutions.

Energy Generation and Delivery Context

Social Vulnerability Analysis: Using 2016 American Community Survey Data and 2010 Census Data, an analysis of overlapping social vulnerability dimensions reveals clusters of vulnerable demographics in specific areas. In the map above, darker colors indicate areas with higher concentrations of these vulnerabilities. Six neighborhoods were selected for a closer look on the following page, each highlighting similar critical vulnerability factors. In these neighborhoods, an average of 34.85% of residents live in poverty—almost double the rate for the greater Memphis metropolitan area. Non-white residents represent 96% of these neighborhoods’ populations, with 71% identifying as Black. Additionally, 27% of residents lack health insurance, nearly twice the metropolitan rate, and 70% are renters, also double the regional average.
